|
New
Orleans Canals
A historical look at New Orleans canals and
population sprawl from the 1720s to
present, and then Katrina. Basically, this graphic shows that the
flooded areas were once uninhabited swamps. As the
city grew, more canals were needed to keep the new neighborhoods
(swamps) dry. The oldest areas of the city did not flood
since they were originally built on the higher ground near
the Mississippi River. |

|
Victims
Of Katrina: Where They Were Found
This big map plots the locations where bodies
were found after the storm. Map also shows the flooded areas of
the city.
|

|
Multiple
Lines Of Defense
This graphic shows one of the many ideas
sprouting up from planning experts. |

|
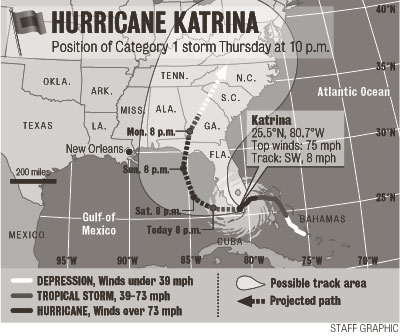
Katrina's
Initial Track
The first tracking map we did before the
storm shifted toward New Orleans. We thought we were in the clear
at first.
|
|
How
Much Water Did You Get?
I was getting
frustrated that nobody had released a map showing the overall picture
of flooding. So, I
spent many hours plotting the estimated flood depth throughout New
Orleans using a website that showed the maximum flood depths when you
clicked on a certain location. |
|
Water
Emptying After Levee Breaches
Okay, so the maximum flood depths map was
cool and helpful for readers, but how much water remained in the city? |
|
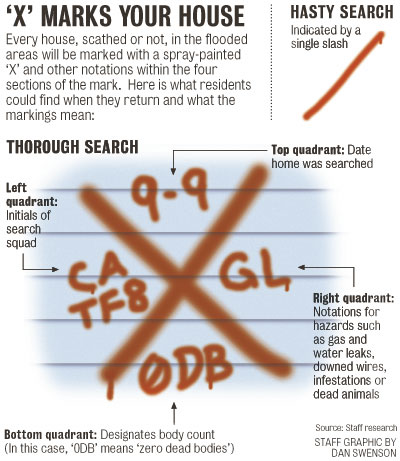
X
Marks Your House
Nearly every house in New Orleans was searched
for bodies and hazards, then the findings were noted by a spray paint
marking left on the front of homes. This graphic explains what the
cryptic markings mean. |
|
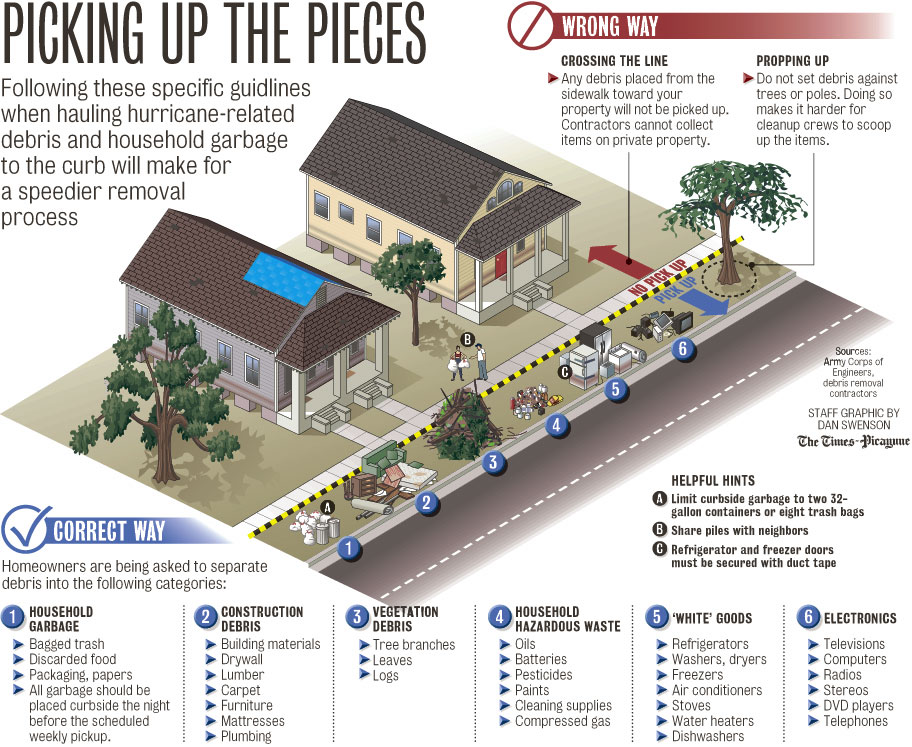
Picking
Up The Pieces
Being a homeowner in New Orleans myself, I
discovered quickly that clean-up crews would pick up your hurricane
debris quicker if it was separated. So I spoke with the Army Corps
of Engineers and some contractors to create this graphic as a valuable
reader service. |
|
Super-sized
Task
Just how much trash/debris did Katrina leave
in her wake? Billions of tons??? What does that mean? |
|
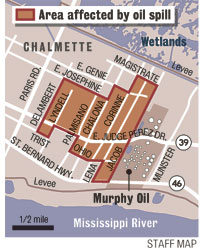
Murphy
Oil Spill
This is just a simple locator, but if you
could drive through this area like I did, you would see some why it
is such a huge story for the homeowners in Chalmette. |
|
Why
Did The Floodwalls Fail?
Well, multiple reasons according to what we
have found out so far, but when this graphic was created, speculation
was the primary theme. |
|
|
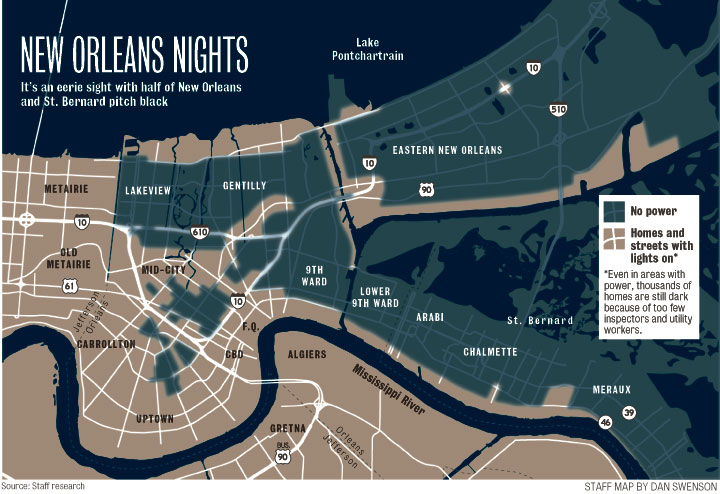
New
Orleans Nights
After driving around post-Katrina New Orleans
at night, I thought it would be very cool to show the readers what
I saw ... an eerie, pitch dark reminder of just how many people were
left homeless by this super storm. The energy company was not releasing
power outage maps, so I drove all over the city, nearly 200 miles to
map out the grim picture. |
|
|
Battle
Against The Sea
The Dutch fortified their below sea-level
country with state-of-the-art flood control structures after a huge
storm killed over a thousand people. This graphic could be a glimpse
into the future of New Orleans if the government does what is right. |
|
|
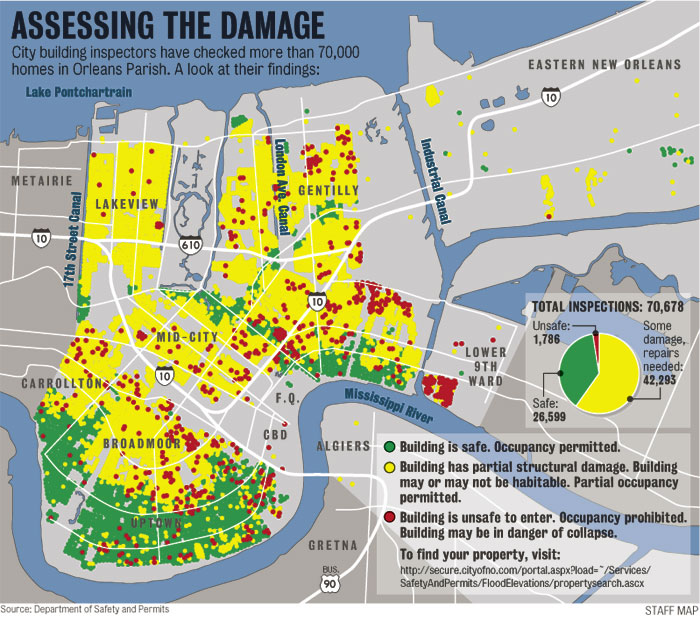
Assessing
The Damage
Inspectors released their preliminary findings
on the damage in New Orleans ... don't believe it. This map I created
from their data DOES NOT reflect how bad the damage really is. |
|
|
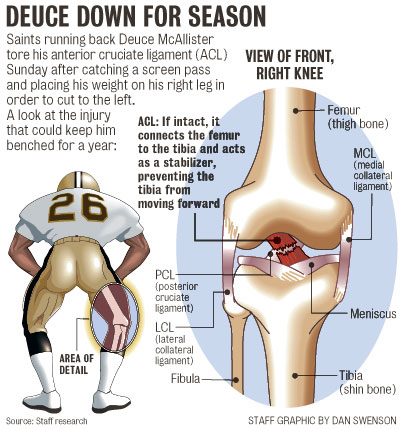
Deuce
Down For Season
If Katrina wasn't bad enough, New Orleans
lost their star running-back to an ACL tear. This was my first non-Katrina
related graphic in nearly 2 months. |
|
|
Katrina's
Exodus
According to FEMA, New Orleans evacuees spread
out to every state in the country. Look closely at this map ... kind
of resembles a water balloon being thrown (the storm track) against
a wall, dispersing water droplets (people) all over that wall. |
|
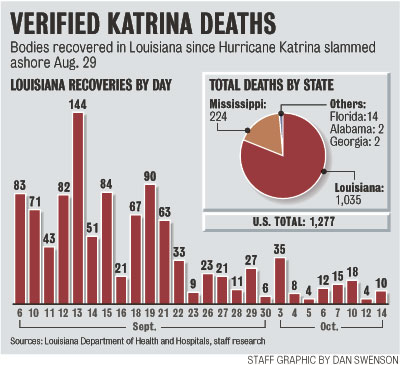
Verified Katrina
Deaths
This graphic is now outdated, but it still
gives you a sense of the number of bodies recovered by day since the
storm
hit. |
|
|
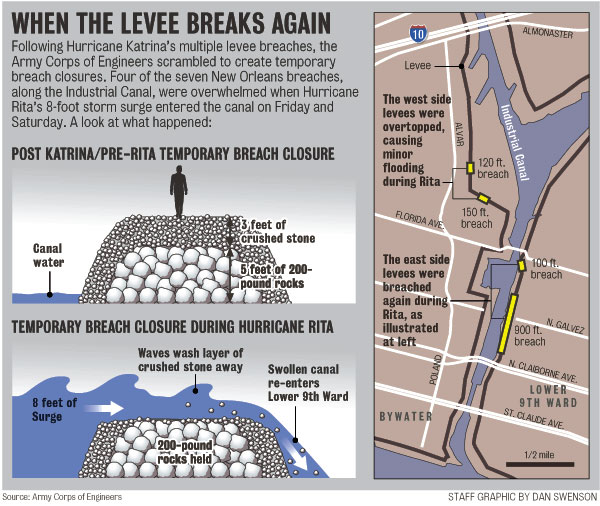
When
The Levee Breaks Again
When Hurricane Rita struck
just one month after Katrina ravaged us, a few of the levee breach
patches could not hold back surge from Rita even though she made landfall
on other side of Louisiana. It's not safe here. |
|
|
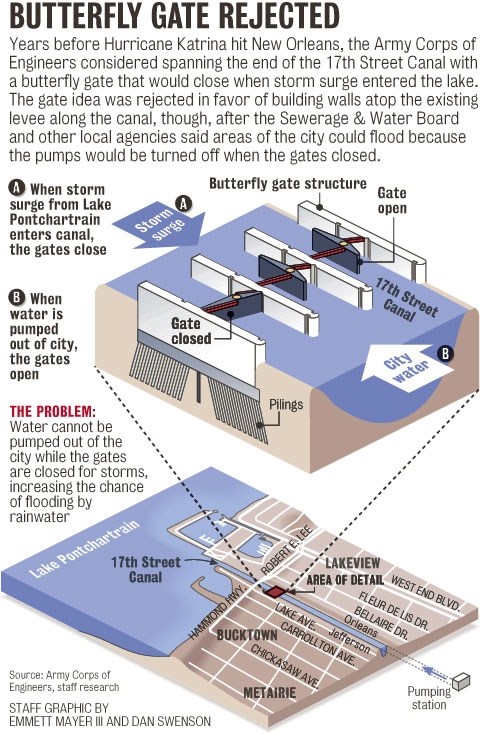
Butterfly
Gate Rejected
A few years ago, officials rejected a great
idea for flood control. Take a look at what could have saved New Orleans. |
|
|
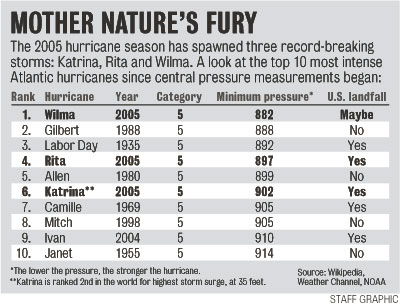
Mother
Nature's Fury
I compiled
this simple table just to
show how insane the 2005 hurricane season had been. |
|
|
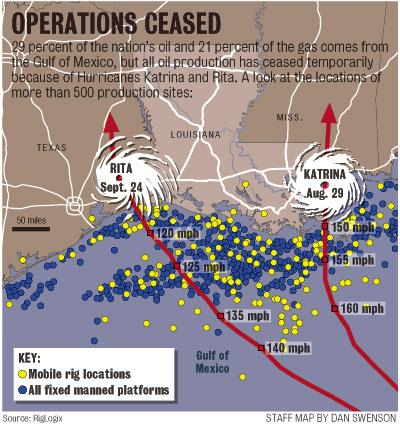
Operations
Ceased
Oil production came to a halt in the Gulf
of Mexico after hurricanes Katrina and Rita. Look at all those drilling
platforms! No wonder gas prices soared ... of course none of it was
price gouging, right? |
|
|
Soil
Heave
The latest theory on why some levees failed
turned out to be fact.
|
|
|
Clearing
The Pipes
How crews cleaned out natural gas mains. |
|
|
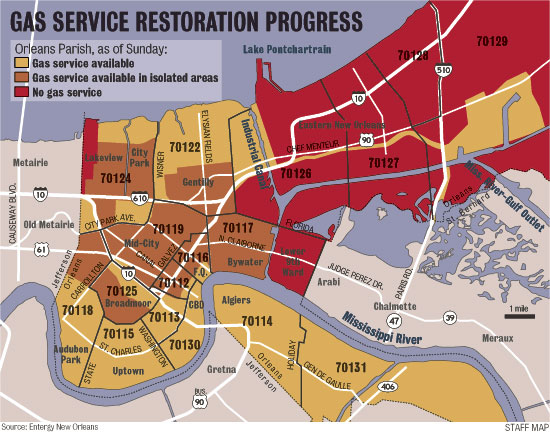
Gas
Restoration Progress
Another outdated map, but probably still fairly
accurate as of 11/30/05. |
|
|
Flooding
Zone
Unbelievable. This graphic is kind of confusing
and I will not dare to explain it more than what you see here, but
I can tell you that BFE stands for OUTDATED BASE FLOOD ELEVATION. |
|
Crazy
Season
Please God, is it over yet? |